
Tuesday, August 22, 2006
Return to Risky Assets?
here's a 3 month chart comparing the MSCI EAFE, Mexican IPC, and S&P 500. It really depends on what you're looking for and the time period you're looking at as to what conclusions you can draw from this comparison. That being said this chart is a little surprising to me, although maybe it shouldn't be. Doesn't look to be much upside left in emerging markets unless the US experiences a sustained, committed rally (not likely) - world markets are falling more with bad US news and rising comparatively less with the good. Another reason to be skeptical of last week's rally.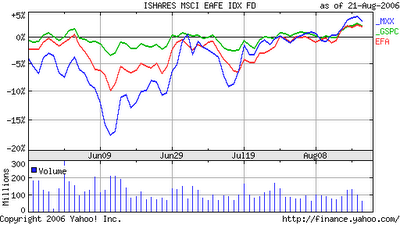
Subscribe to:
Post Comments (Atom)

No comments:
Post a Comment