Tuesday, September 19, 2006

Bush's Oil

Hilarious chart from Ticker Sense this morning showing Bush's approval ratings charted against the price of gas at the pump:

(TickerSense 9/19/06)


But we're still in Iraq for the cheap oil, right? At least according to all the protestors I pass every Friday on my way home from work we are. Give it a rest. Please. I hate to say it, but the Grassy Knoll seems like a fresh topic worth entertaining at this point.

On the global scene, here is a chart showing the number of inflammatory statements directed towards Israel by the Iranian president along with his approval rating:


Monday, September 18, 2006

US back in Vogue

Here is the performance of various assets over the past week from the WSJ:


It appears investors' appetite for risk is up slightly looking at the growth of small cap and tech stocks last week, but still wary of emerging markets - more money has moved into US and Euro Large Caps than the EMs. The search for higher returns re-focused investors on US markets, and I think we'll see more shuffling between US large/small/mid caps and among US sectors before we see any significant branching out to global stocks again.

Friday, September 15, 2006

NYSE/Euronext Merger Mania

For anyone as interested in this merger as I am, at the bottom of this site there is a table that allows you to get an idea of where the current Euronext share price is at versus where it should be/what it's worth. It's below all the posts but above the "under construction" segment at the VERY bottom.

As a side note, the current interest in NYSE and Euronext stock is very high when you consider that the estimated market cap from NYSE in the June disclosure is $20 billion - more than a billion UNDER what investors currently have sitting in these exchanges. I don't think NYSE anticipated their estimate to be under what it is really worth. Especially when you consider the market cap was around $18 billion one month ago. It's no wonder companies doing the buying in mergers historically tend to underperform. And I don't think that says anything about the buying companies necessarily, just seems to be the nature of the beast.

South African Gold

While I have previously commented on the potential for growth in South African markets related to hosting the World Cup, the country has caught my attention again for a different reason. While the gold selloff from its May peak has been downright nasty, things in the Johannesburg Stock Exchange (as measured by the EZA ETF) have been far worse. Gold prices and risk aversion in the form of emerging market selloffs have been a double-whammy for South Africa, however when I see EZA and the price of gold (GLD ETF) I can't help but think there has been some over-selling here. The first half of the year saw gold and the JSE move fairly closely together, parting ways after the May/June selloff:


Notice that after the two separated, from July through the present they are highly correlated directionally, they are just at very different levels relative to where they began the year.

Warranted or unwarranted?

What we can infer from the above chart is the relative expectations the market has regarding non-precious metals sectors in the South African market. If the JSE were composed entirely of precious metals/gold stocks the two lines above would overlap almost entirely. The deviation can be thought of as the returns on the remainder of the companies that make up the JSE, and I don't see how the outlook for the remainder of the market can be THAT awful, despite the riskiness of the market.

I don't think there is any doubt that any investment in South Africa should be thought of as long-term in nature, but I do think the outlook is more promising than the market is currently giving it credit for.

Thursday, September 14, 2006

When Growth Isn't Growth

photo by Sandrine Huet


Great Long & Short column in yesterday's WSJ recounting some highlights of economic affairs since 9/11. Nothing earth-shattering, but I thought the idea of looking at trends since 9/11 in the market was noteworthy - it's always helpful no matter what you're doing to take a step back and gather some perspective.

The discussion about corporate profit growth having nowhere to go but down is spot on - 17 quarters of double-digit profit growth combined with an increased number of share buybacks and m&a activity (read: little investment in future profit-generating, productive resources) doesn't paint a bright picture for earnings growth down the road.

Profits (wages) as a share of GDP are abnormally high (low), meaning that companies can easliy absorb increases in costs (energy) without putting a lot of pressure on the overall price level. This is one reason why it feels like the inflation readings should be higher than they are, but it simply hasn't materialized to this point. As the situation unwinds, however, the opposite will not be true - if wages begin to increase their share of GDP at the expense of profits, earnings will begin to disappoint and prices will certainly rise - a double-whammy when combined with a flailing housing market.

The level of earnings/profit growth is a direct result of companies keeping a larger percentage of their profits as opposed to re-investing them - if you decide not to buy a car you'll instantly be $50,000 richer but you'll be poorer in the long-run when you lose your job for not showing up. This is the kind of mentality that the oil industry has been criticized so heavily for (they're robbing us blind and not building new refineries!), but it seems like we're giving many other companies posting monster earnings growth quarter after quarter a free-pass despite their increasing similarity to oil companies' modus operandi.

In the end I think we'll remember that productive resources and innovation drive growth (which requires spending and lower near-term profits) - not simply re-distributing money so that more of it passes through everyone's hands.

Wednesday, September 13, 2006

Volatility Anyone?

Volatility in the Nasdaq has taken sharp turn upwards even by historically volatile Nasdaq standards. The chart below shows the volatility indices for Nasdaq in blue and the S&P in red - the Nasdaq is around 75% of its peak during the May/June selloff, while the S&P is nowhere near its June peak:

To add some perspective about how volatile the Nasdaq is now, the relative volatility of the Nasdaq versus the S&P is now at a 2-year high:


What this means for the levels of the S&P/Nasdaq isn't clear, but there appears only one way to go for the future of the volatility spread. It would be interesting to look at periods where the volatility spread is relatively high or low and how the respective markets performed.

The Miraculous Dow

Due for a correction?

Tuesday, September 12, 2006

Groundhog Rally

Another run-of-the-mill rally off the back of falling oil prices, by now a very familiar sight. While not unexpected (see yesterday's post, previous posts on this site re:oil prices), I still have some issues with how many times the market has rallied this year in response to oil price slides of varying degrees. The run-up in oil prices the past few years has not hampered the growth in corporate profits, and there have been as many explanations for this as there have been oil-based rallies - the US economy operates using far less oil per unit of output than 10 years ago, we live in a service-based economy and oil price spikes are a concern for developing countries that are newly industrialized...you get the picture.

So when oil futures drop off (in a predictable manner), shouldn't the reverse be true? Why should we anticipate that a slide in the price of oil would stimulate/stabilize profit growth? Especially in the immediate future - if the effects of oil price increases operate on a lag, shouldn't the same lag delay any expected benefits from falling oil prices?

The only immediate impact of oil's price is reduced gas prices at the pump, which I don't feel will have the consumption-inducing effect the market is hoping for. I felt that $60 oil would push the market to test its highs, and at $64 and the DJ at 11500 I feel even more confident that will be the case if oil gets that low, and I just don't think it is a rally that has staying power.

In more general news, this morning's WSJ notes that global fund managers' outlook for corporate profits has fallen to lows not seen since 2001. That doesn't mean they are bearish, however, as the same segment also notes increased optimism regarding the global equity outlook. So...defensive sectors are leading the way, but triple-digit rallies come on the back of oil price news. This market is semi-schizophrenic and the tension has investors looking for love in all the wrong places.

Monday, September 11, 2006

O-I-L spells relief

The drop off in oil prices over the last few months has investors excited as the price of crude pushes 6-month lows. As I've commented in this blog before on the upcoming price decline (here and here) to be expected, this development should not surprise investors nor should it surprise anyone, really. The cyclical behavior of oil is certainly not new, and the price still hasn't fallen as far as it could based on the last two fall/winter slumps in price.
In other speculative news gold has taken an absolute beating today relative to oil. The correlation between oil and gold is well established, but it seemed as if gold had found its own support levels and wouldn't be as severely impacted by the recent drop in oil prices. I really didn't anticipate the drop in oil prices having this drastic of an effect on gold. Here is the chart over the past week, today really stands out:

Wednesday, August 30, 2006

Mid-week Update

The market is higher than anticipated in last fridays post, largely due to reaction to the GDP number. GDP was revised upward primarily due to rising inventories, which will (as the thinking goes) reduce price pressures and signal the end to the rate cycle for good. I still haven't seen inflation data that convinces me there aren't any more rate increases coming - a slowing economy typically relieves pricing pressures, but the pressure built up in this market has been delayed for so long that I'm not sure a slowing economy will be enough to assuage inflation fears fast enough for the markets expectation. Think about the effect slow growth has on inflation like the lagged effect of monetary policy -it will not be overnight and it could be some time for price pressures to come down. Also, debate on whether or not energy prices can be ingored with respect to Fed policy has died down considerably and I think that there is some risk to not looking at potential effects of a consolidated build-up in energy prices like we have seen over the past few years. I don't know how many times the market is going to rally on the same news (the end of the rate cycle) only to run up against the same fears. I guess at least one more time.

NYSE/Euronext update

From my original post on aug 18th re: the proposed details of the merger, NYSE stock is down 1.6% to 59.05 (from 60.00), while euronext is up a nice 5.1% to 69.80 euros (from 66.40 euros).

Vacation

I'll be out on vacation the remainder of this week and next, so posting will be sporadic.

Friday, August 25, 2006

The week ahead - Monday, August 28

The market is still debating whether or not a slowing economy is a good thing for stocks. It appears that the sentiment for the time being is still in favor of a slowing economy (end of rate cycle) versus signs of growth (inflation). As soon as rate/inflation uncertainty is resolved then the market will digest what that means for stocks. Whether or not that is the best philosophy for the long-term is debatable, but at least for now that is how the market is reacting, and until proven otherwise we can assume it will continue.

That being said, the data lineup for next week includes the Fed meeting minutes and 2 qtr GDP during the first half of the week. The minutes really don't have any room to surprise on the upside as the no-more-rate-increase rally went off 2 weeks ago, and I anticipate a somewhat muted to negative response to the minutes. Same story for GDP, I don't see any plausible scenario for the market cheering the GDP number regardless of where it falls. Thursday has factory orders, personal income, & jobless claims - some back-and-forth potential, but nothing earth shattering. Perhaps the bulls will try to regain some lost ground on the back of the no news. On the plate for Friday: manufacturing and two housing-related numbers - construction spending and pending home sales. On the back of further housing sector weakness I think we could see an attempted rally Friday, but I don't see it pushing the dow back into positive territory for the week.

Of course oil prices remain ever-important, and have the potential to turn next week into a big red week, or some relief could push up a week of modest gains. We'll see, but I think negative sentiment continues to permeate the market and I don't see much rally-sparking potential.

Wednesday, August 23, 2006

Housing Headwinds

TickerSense had a group performance matrix today showing relative sector performance over the past 20 days, and two sectors really caught my attention - housing and energy equipment & services. Both are buried in the middle, and by just looking at the average you would think they are fairly stable. However both of these sectors have had an unusually large number of days where they were either best or worst performing sector. The volatility in energy equipment is understandable as energy prices are far more volatile than mortgage rates.

So what's the deal with homebuilder stocks? They had 3 days with the best performance and 3 with the worst. Not really sure quite what to make of investors who propelled housing stocks to the top for those three days...I thought it was a relatively straightforward story - interest rates are high and driving up mortgages, prices are bloated, inventories are building up, homebuilder sentiment is near record lows...the list goes on. With homebuilder sentiment and overall prospects for growth what they are I think homebuilders have far more downside exposure at this point, but it appears as if the market is having a difficult time forming a consensus regarding homebuilder stocks. It will be interesting to see if they post fewer days in the green as we get even more info about the housing cooldown.

Tuesday, August 22, 2006

Return to Risky Assets?

here's a 3 month chart comparing the MSCI EAFE, Mexican IPC, and S&P 500. It really depends on what you're looking for and the time period you're looking at as to what conclusions you can draw from this comparison. That being said this chart is a little surprising to me, although maybe it shouldn't be. Doesn't look to be much upside left in emerging markets unless the US experiences a sustained, committed rally (not likely) - world markets are falling more with bad US news and rising comparatively less with the good. Another reason to be skeptical of last week's rally.

Monday, August 21, 2006

Oil Price Debate - part II

How will oil prices affect the market for the remainder of the year? Seeing as the market is poised to rally at the drop of a hat in response to any good news (as evidenced by last week), the cyclical decline in oil prices towards year's end could spark a disproportionately large rally (a somewhat hollow one as well). If oil surprises on the downside I don't see how the market could contain itself given the tension and nervousness present these days, and you would have to believe markets would test their 2006 highs if such a scenario were to take place. I believe we can expect oil to dip in the neighborhood of $65, with a downside surprise occurring at around $60. So if oil gets to around $60 this winter - look out below. Heck, given the current market sentiment $65 a barrel oil could light a fire under the markets.

Oil Price Debate

Recent talk of drastic oil price drops given recent price declines seem to me to be overly optimistic. These scenarios rely too heavily on a number of assumptions that are unlikely to occur, and the likelihood that all will occur together is even slighter still. Here is a chart for the past 2 years of oil prices:

Other than this past February/March, the only time the price dipped below the 240 day MA has been the past two Decembers. The rallies off these December lows were 116% and 89% of the previous Sept/Oct highs. Given these rallies, institutional investors would be more likely to play the historical tendencies than bet against them - buying into the new year and preventing the December slump from escalating.
The past 3 selling periods have topped off at 76% of the previous rally (the current downtrend is at 43%) meaning that even a large selloff wouldn't be likely to breach $65. The 240 day MA and the 76% guideline both point towards a target of $65 for the upcoming 4th quarter slump in oil prices. And that assumes there will not be another rally in prices for the rest of the year.

It does seem like we are moving towards a market where bad news will be net positive once the situation is resolved (upticks getting smaller while relief selloffs getting larger as optimism grows), although I do not see that resulting in any major movements downward over the longer term. China's oil imports are rising at 8% year-over-year with no signs of easing - I don't see how positive news regarding US stockpiles can overcome that 8%.

Friday, August 18, 2006

Yuan Control

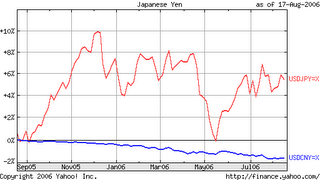
We're all familiar with the lip service given to an increasing Yuan by the Chinese government, but are they finally getting serious? The Chinese government has announced another rate increase on top of their recent efforts to tighten lending restrictions. The end(?) of the US rate hike cycle along with increasing Chinese rates should help boost the Yuan - key word being should. To illustrate how adept China remains at controlling the exchange rate, here is their track record compared to the USD/Yen exchange rate over the past year:
Not going anywhere other than 1.8% a year.

I think we can also deduce the "basket" of currencies China is using to measure the Yuan against by this chart - the US Dollar and a basket of currencies that are pegged to the dollar.

Thursday, August 17, 2006

NYSE/Euronext Merger

Given that the terms have been disclosed for the NYSE/Euronext merger and it includes a cash payout along with share conversion for Euronext shareholders, it will be interesting to see what happens to the prices of those stocks. When you consider that the cash payment is in euros along with the fact that Euronext is traded on three exchanges (I'm only using the Paris price from the euronext site) you get enough variables to create any number of potential plays on this merger.

From the NYSE/Euronext merger details from the June 1 announcement (from the NYSE website):
NYSE shareholders get 1 share of the NYSE Euronext stock per NYSE share.

Euronext shareholders get 0.98 shares of NYSE Euronext stock plus a cash payment of 21.32 euros per Euronext share.

Using yesterday's share prices ($60.00 for NYX, Eur 66.40 for NXT.PA) at yesterday's exchange rate (1.284 Eur/$), you get a $US 85.26 share price for Euronext stock which has a current value of $86.17 (0.98 NYSE shares x $60.00/share + Eur 21.32 x 1.284 Eur/$) - a nice and tidy $0.91 profit per share. That of course assumes that the $60/share market price is the accurate valuation for the new NYSE Euronext stock. If all euronext stock were converted at 0.98 to 1 and NYSE stock 1 to1, there would be a total of 264.52 million shares of the new NYSE Euronext stock. At $60 per share, thats a market cap of $15.87 billion compared to the NYSE estimate of $20 billion. Obviously they benefit from overestimating the valuation, but 4+ billion seems like a rather large discrepancy.

Consider another alternative - the current valuation of each company added together equals the total valuation for the new NYSE Euronext. Under this assumption, total market cap would be $18.8 billion, with a share price of $71.09. If the share price of the NYSE Euronext reaches that level, the current value of holding 1 share of Euronext stock rises to $98.46, a $13.20 per share profit over the current purchase price of $85.26...

It all comes down to where you feel the new NYSE Euronext stock price will fall, and I don't see how it can be any lower than $60/share regardless of what the NYSE price does in the near future. The movement in the NYSE seems to be consolidating around the $60 a share price, and the ratio of NYSE stock price to performance of the underlying stocks (represented by NYC price) is 0.78, with the Nasdaq having a share price to underlying stock value (measured by QQQQ price) of 0.76. You also get to play the dollar's decline by being in Euronext (the cash is in euros).

Throw a third party into the mix and you get even more options. Here is the ratio of the Nasdaq share price to NYSE share price - it has just bumped above the 90-day MA and the Nasdaq looks like it is poised to continue this uptrend versus the NYSE...Nasdaq has kind of sat back watching the NYSE-Euronext tie up and you know they will make a move at some point for the LSE, and I think they will ultimately be successful.


Sorry for all the numbers in today's post, but I thought it essential to taking a look at potential plays in this situation. The exchanges are extremely difficult to value to begin with, so you get a lot of valuations that really haven't been around long enough to have a track record. Who really knows what they're worth? There are so many potential ways to go about it, and you would think at some level the success of the exchanges depends upon the success of their member stocks. The sector has a wild west feel to it right now, and it just feels like the next few years will have been the time to have done the analysis and made the more profitable plays on exchange stocks. There are less and less of them, and they will only become more stable as valuation methodologies mature and the m&a activity in this sector eventually slows.

Wednesday, August 16, 2006

Rally Monkey vs. Kool-Aid Man

Who rang the Opening bell?

Is it time to celebrate? Has the rally monkey been sighted and we're prepared for even more upside - or was it the kool-aid man attempting to add loads of artificial flavoring only to leave us empty?

Today's rally still has me feeling a bit uneasy about the prospects over the next few months, feels like a little too much excitement over a little too little news. It has been noted that PPI and CPI same-month correlation is extremely poor - Tom Graff posted a nice chart yesterday on his Accrued Interest blog illustrating this point and how volatile PPI readings are. As for today's CPI number the WSJ had an interesting article a couple days back about the imprecision inherent in the BLS data as a result of rounding to a tenth of a percent. This means that instead of dropping a full 0.1% from 0.3% to 0.2%, the more likely scenario is something along the lines of 0.254% falling to 0.243%. Not much to write home about.

Bonds and stocks have been humming along the last 2 days, and I don't see how they can both be right (can you guess who I side with?) - both markets are now rallying based on the same news and you suspect someone is going to get burned. No further rate hikes is truly great news for the bond bulls, not so much for stock bulls. This has everything to do with WHY there won't be any further hikes as opposed to the fact that there just won't be any. The last time the market cheered this much for a slowing economy and rapidly cooling housing sector was...it doesn't really matter. They're cheering now, and that's the point. Throw in the possibility - as unlikely as it may be - for another rate hike prior to the end of the year and the outlook for stocks is even worse. Personally I'd rather be prepared to weather the worst and try to avoid the ever-tempting kool-aid at this point.

thanks to kool-aiddays.com for the great photos

NYSE/Euronext Merger

Enter the current share prices for NYSE and Euronext, as well as the USD/Euro Exchange rate and hit "calc" to view relevant data. Deal was announced 6/1/2006.

NYSE Share Price:
Euronext Share Price (Eur):
USD/Eur Exchange Rate:
Market Cap of NYSE+Euronext as of 5/31/06:(blns $US):
Current Market Cap of New NYSE/Euronext (blns $US):
Current Euronext Share Price in USD:
Euronext Change from 5/31/06 Close: % NYSE Change from 5/31/06 Close: %
Valuation of Current Euronext Shares
(a) Using current NYSE Price as new NYSE/Euronext Price:
(b) Using current Market Capitalization for NYSE/Euronext:
(c) Using $20 billion as Market Cap for NYSE/Euronext: