Where do Bubbles Come From?
Doing some thinking about various predictions I made in older posts along with predictions made by other bloggers, and it seems as if they are generally correct. Which got me to thinking if that isn't how bubbles begin - with widely predictable environments.
General macroeconomic developments are not that difficult to wrap your mind around and anticipate. Inflation isn't going to go from 2.7% to 0%, or to 5% overnight. It seems like bubbles really pick up steam when a majority of market participants correctly predict market events, and are not the result of wild "speculators" and other fools who placed incorrect bets.
The creation of bubbles seem (at least to me) to be the result of individuals following a very rational, typical line of reasoning. To the individual investor, you make a prediction about how the market is going to unfold over the next couple days, weeks, months, and even years. You then base your investment decisions based upon those predictions. Data is constantly coming in, and as data seems to corroborate your position, do you stick to your original allocation? Most likely not - you would act AGAIN based upon the same prediction. Even though your prediction is already priced into the market. Maybe you wouldn't act immediately, but as you see it is becoming a consistently winning sector or strategy, the impatience and urge to act again builds.
This is especially true if your prediction is initially luke-warm, but gains steam over the long run. You tend to pat yourself on the back by re-investing based upon your predictions. This process repeats itself numerous times, and across the market among many investors - as events unfold according to widely predicted events, investors are increasingly pursuing the same strategy, and upping their positions as data shows that they were right. And as the market is revealing its verdict that the prediction was correct, the predictions become more optimistic, even though nothing has fundamentally changed save other investors agreeing with your strategy.
The whole point of this is that the market has correctly been anticipating a slowdown for some time now, and as that scenario is slowly unfolding, several "congratulations" rallies have occurred. The market has congratulated itself for correctly (up to this point) predicting macroeconomic conditions, but can't seem to remember what the initial investment rationale was behind the positioning. Large Caps are the place to be in this slowing environment (who didn't see that one coming, the return of large-caps has been discussed for years now), but in a slowing environment should they be leading the market to all-time highs on a routine basis?
I think that impatience gets the best of investors in the formation of bubbles, and there is certainly plenty of that going around in this market. That is not to say that the current investment environment is frothy, but it seems to be inching closer.
Friday, November 17, 2006
Wednesday, November 15, 2006
Not so NYSE
Total Capitalization for the combined NYSE and Euronext has gone up 44% to 26.6 billion (as of this post). The breakdown for each stock is a 32% increase in Euronext Price, 56% increase in NYSE price since 5/31 closing prices (the day prior to the release of the merger details).
Euronext shares are getting hammered today, off 5.3% thus far on the news of Deutsche Bourse backing out of merger talks, however NYSE shares are up.
The point of all this is that NYSE stock is extremely overbought - I can't imagine that the merger with Euronext will make the company 44% more valuable (profitable) than they were as separate entities, and I think the new NYSE/Euronext stock is in for a bumpy ride as a result. Especially when you consider NYSE shares have outgained Euronext shares by more than 20%, and have not been affected to this point by the news that DB is no longer pursuing Euronext. Less competition means less bidding up of the stock, and NYSE shares would be expected to drop on this news.
The fact that NYSE shares have not been dragged down by the DB news and Euronext share plummeting isn't the only unique aspect of this merger. Typically the acquiring company doesn't outperform the target company's stock by 20%, especially considering each company will operate in a different regulatory environment. Combine this with some of the public statements by Mr. Thain guaranteeing the deal will go through (back when the NYSE share price was not that attractive and DB was still in play), and the NYSE appreciation smells a little funny. A lot of institutional investors have a vested interest in ensuring that the NYSE share price is attractive enough to see the deal through, and some of the one-day returns are abnormal to say the least. Seems as if the share price has become detached from the reality of the deal and any type of outlook on future profitability and is being driven more by the collective self-interest of NYSE shareholders. Almost every day after the NYSE price jumps significantly, it drops back on profit-taking. Can't say I blame them, I'd probably cash out at this point as well.
Friday, September 29, 2006
Thain Train
In a WSJ article this morning John Thain was fairly confident that the offer on the table will be accepted by Eurnoext in December:
I'm not sure how he can make this type of a guarantee when NYSE stock has been as volatile as it has been since the deal was announced in June, but let's assume for the time being that he is correct and the price of NYSE shares holds up, at least until December.
Keep that in mind while reading the following paragraph from the article:
A couple questions for Mr. Thain - Tell me again what will be combined? So the current NYSE price will hold up, but you're not merging operations? What IS merging other than the human resources and I.T. departments?
The recent NYSE appreciation seems a little steep for some new computers and a snazzy marketing campaign...I don't see how this deal can justify the recent NYSE share appreciation when the efficiencies you would expect from the deal are hampered by the details of the deal itself. The deal sounds great in principle, but I think the new shares are in for a bumpy ride. Especially when you consider that since the deal was announced, NYSE shares have outperformed Euronext shares on the back of this week's gains:
Volatility in the NYSE, as measured by a 5-day moving average of hi-low spread, is at its highest level since the merger was announced, while Euronext has logged steadier gains with less volatility.
The timing of Mr. Thain's announcement (on the heels of a 3.7% price jump in a single day) is just a little suspect - is it out of the question to think that an exchange such as the NYSE could call in a few favors to boost its share price? Conspiracy theories aside, the current valuation of the NYSE is high no matter how you look at it compared with the additional profitability and value added to the NYSE by this deal.
"Our deal has to look economically attractive at the time they vote -- and it will"
I'm not sure how he can make this type of a guarantee when NYSE stock has been as volatile as it has been since the deal was announced in June, but let's assume for the time being that he is correct and the price of NYSE shares holds up, at least until December.
Keep that in mind while reading the following paragraph from the article:
The NYSE and Euronext plan to combine technology platforms, but not the markets they operate. European officials prefer this because it keeps U.S. regulations out of Europe. Mr. Thain said the exchanges aren't contemplating merging operations, but he did say convergence of regulation across borders would be desirable, particularly if changes are made to the U.S. Sarbanes-Oxley law.
A couple questions for Mr. Thain - Tell me again what will be combined? So the current NYSE price will hold up, but you're not merging operations? What IS merging other than the human resources and I.T. departments?
The recent NYSE appreciation seems a little steep for some new computers and a snazzy marketing campaign...I don't see how this deal can justify the recent NYSE share appreciation when the efficiencies you would expect from the deal are hampered by the details of the deal itself. The deal sounds great in principle, but I think the new shares are in for a bumpy ride. Especially when you consider that since the deal was announced, NYSE shares have outperformed Euronext shares on the back of this week's gains:
Volatility in the NYSE, as measured by a 5-day moving average of hi-low spread, is at its highest level since the merger was announced, while Euronext has logged steadier gains with less volatility.
The timing of Mr. Thain's announcement (on the heels of a 3.7% price jump in a single day) is just a little suspect - is it out of the question to think that an exchange such as the NYSE could call in a few favors to boost its share price? Conspiracy theories aside, the current valuation of the NYSE is high no matter how you look at it compared with the additional profitability and value added to the NYSE by this deal.
Thursday, September 28, 2006
Yesterday
Here's yesterday's chart with the S&P 500 added, and the FF Rate/2-YR spread flipped around to represent the amount that 2-year treasuries yield over the target FF rate:
As noted yesterday, the only other time on this chart when the 2-year yield was below the FF rate and above the 10-year yield was in 2000.
Wednesday, September 27, 2006
Stock and Bond markets as predictors
The WSJ ran an article this morning re: the strong rallies we're seeing in stocks and bonds, and the competing views of the future these rallies imply. Either growth will remain strong and inflation under control and stocks have it right, or growth will disappoint to the point where rate cuts will be needed to stimulate the economy and inflation will be a peripheral concern. I have posted on this topic previously, and I still tend to side with the bond bulls.
A couple things - first, the Fed's stated focus on inflation is at this time a bit overblown and behind the times given the data, and I think the only reason they have not altered their statement to reflect any downside growth risk is that BB must still live up to the Fed's history as a staunch inflation fighter. His not wanting to include downside growth risks along with inflation risks has single-handedly brought the markets to near all-time highs, and by the time growth slows to the point of revising the Fed statement, it will come as a HUGE surprise to the stock market. Expect this to happen early next year.
Second, here is a chart showing that if history is any guide the FF rate will be in for some hefty adjustments next year. The only other time since 1990 the yield curve was inverted (measured here by 10-yr/2-yr spread) AND the 2-yr yield was below the target FF rate was in 2000...
Obviously the past is not necessarily indicative of the future, but I think the Fed has to ease at some point next year. The likelihood that they hit it dead-on with 5.25% is next to none, and another rate increase would absolutely rattle the markets at this point - it's a little shaky as it is. I think the Fed is pigeonholed into keeping rates steady for the remainder of this year to preserve its inflation-fighting cred, but as soon as BB thinks he can get away with it, the Fed will cut.
Friday, September 22, 2006
Who Determines Rates on Bonds of Varying Maturity
Pondering yesterday's post on Accrued Interest re: implied rate odds and the yield curve got me thinking about the relationship between the fed funds rate and bond yields at its most basic levels. There is an enormous amount of complexity and variety that now goes in to analyzing this relationship, and I wanted to shy away from that at the moment. I thought it would be interesting to take a look at what length of maturity the Fed likes to trade in.
Wish I had some more up-to-date numbers, but this graph will have to do to illustrate the point. Using data from an older FRB document covering the years 1975-1997 it looks at the average maturity of bond portfolios held by the Fed and by the market:
Prior to 1980 the Fed had a longer maturity portfolio than the market, however the 80's saw a rapid turnaround with the market having portfolios of bonds with twice the maturity by 1991 and sustained this trend through 1997. The Fed during this period essentially dealt with 3-year bonds or less. The Fed apparently decided that it would only attempt to influence rates on the short end at let the market make up its mind regarding longer maturities. You can see that anything beyond 5 years is simply the market placing bets amongst itself and taking cues from the Fed on the short end.
Wednesday, September 20, 2006
So High
Oil at $60 and the Dow finishes at 11613.19 - 4th best all time, and only 29.46 points off the year's high of 11642.65. How quickly things change. A few weeks ago oil was still around $73 and the market was hitting severe headwinds, up one day and down the next.
A month ago when it was still debatable as to which direction oil prices were headed I posted my thoughts on the Dow testing its 2006 highs. Here we are, and I still believe that this rally is setting itself up for a sizable drop off. The run-up in oil prices didn't dent profit growth, I doubt the slump in prices will have the reverse effect. Sans oil not much has fundamentally changed about the economy since a month ago (even the National Federation for the Blind saw the housing slump coming) - so what gives?
If you predict that it will rain tomorrow and you act on that prediction by purchasing a raincoat, when it rains the next day do you buy another one or are you content with the position you took prior to your prediction? Supposedly the market priced all of this in months ago, right? Housing slowdown, commodity slowdown, oil relief...it goes on and on - so why the rally now? When everything goes as scripted it might just be time to worry.
Keeping One Eye on the Road
Driving a car is an activity where the range of potential distractions necessitates you keep an eye on the road at all times. Whether you're passing a 5 car pile-up or have a screaming child in the backseat, other drivers on the road and passengers in your car count on you to sidestep those distractions and pay just enough attention to the road to arrive at your destination safely. You depend on the other driver as much as you do yourself to remain in one piece.
Much like driving a car, both the market and the Fed must not only be aware of where the other is, but they must also keep an eye on the road - the objective economic environment (outside of the FF rate, bond yields, and equity prices). Earlier today I thought I saw two drivers staring at each other, and not minding the road ahead of them - TickerSense mentioned that (at least) one Fed governor believes in the predictive powers of the yield curve. Now I know that the bond market is fixated on the Fed, but if the Fed were to be staring back with the same focus the situation would be a little uncomfortable.
With the Fed looking at the yield curve, the yield curve being derived from FF rate expectations - who exactly would be doing the driving? This is not to say the Fed should not look at bond yields or consider their impact, but if the almighty Fed believes the bond market can predict future economic conditions then why have the Fed meetings and all their black-box calculations enter into the decision at all? Why not just peg the FF rate to the 10 year? Probably because it would be a disaster. Probably because what makes the system work is that the Fed and the bond market represent two distinct interpretations of the same objective economic conditions that are both necessary. That the conclusions are often the same is not important, often they are not, and what is important is that there remains two separate methodologies for processing data and formulating ideas about the state of future economic affairs. Hopefully the two don't stare directly at each other and they keep at least one eye focused on the road.
Tuesday, September 19, 2006
Bush's Oil
Hilarious chart from Ticker Sense this morning showing Bush's approval ratings charted against the price of gas at the pump:
But we're still in Iraq for the cheap oil, right? At least according to all the protestors I pass every Friday on my way home from work we are. Give it a rest. Please. I hate to say it, but the Grassy Knoll seems like a fresh topic worth entertaining at this point.
On the global scene, here is a chart showing the number of inflammatory statements directed towards Israel by the Iranian president along with his approval rating:
Monday, September 18, 2006
US back in Vogue
Here is the performance of various assets over the past week from the WSJ:
It appears investors' appetite for risk is up slightly looking at the growth of small cap and tech stocks last week, but still wary of emerging markets - more money has moved into US and Euro Large Caps than the EMs. The search for higher returns re-focused investors on US markets, and I think we'll see more shuffling between US large/small/mid caps and among US sectors before we see any significant branching out to global stocks again.
Friday, September 15, 2006
NYSE/Euronext Merger Mania
For anyone as interested in this merger as I am, at the bottom of this site there is a table that allows you to get an idea of where the current Euronext share price is at versus where it should be/what it's worth. It's below all the posts but above the "under construction" segment at the VERY bottom.
As a side note, the current interest in NYSE and Euronext stock is very high when you consider that the estimated market cap from NYSE in the June disclosure is $20 billion - more than a billion UNDER what investors currently have sitting in these exchanges. I don't think NYSE anticipated their estimate to be under what it is really worth. Especially when you consider the market cap was around $18 billion one month ago. It's no wonder companies doing the buying in mergers historically tend to underperform. And I don't think that says anything about the buying companies necessarily, just seems to be the nature of the beast.
South African Gold
While I have previously commented on the potential for growth in South African markets related to hosting the World Cup, the country has caught my attention again for a different reason. While the gold selloff from its May peak has been downright nasty, things in the Johannesburg Stock Exchange (as measured by the EZA ETF) have been far worse. Gold prices and risk aversion in the form of emerging market selloffs have been a double-whammy for South Africa, however when I see EZA and the price of gold (GLD ETF) I can't help but think there has been some over-selling here. The first half of the year saw gold and the JSE move fairly closely together, parting ways after the May/June selloff:
Notice that after the two separated, from July through the present they are highly correlated directionally, they are just at very different levels relative to where they began the year.
Warranted or unwarranted?
What we can infer from the above chart is the relative expectations the market has regarding non-precious metals sectors in the South African market. If the JSE were composed entirely of precious metals/gold stocks the two lines above would overlap almost entirely. The deviation can be thought of as the returns on the remainder of the companies that make up the JSE, and I don't see how the outlook for the remainder of the market can be THAT awful, despite the riskiness of the market.
I don't think there is any doubt that any investment in South Africa should be thought of as long-term in nature, but I do think the outlook is more promising than the market is currently giving it credit for.
Thursday, September 14, 2006
When Growth Isn't Growth
Great Long & Short column in yesterday's WSJ recounting some highlights of economic affairs since 9/11. Nothing earth-shattering, but I thought the idea of looking at trends since 9/11 in the market was noteworthy - it's always helpful no matter what you're doing to take a step back and gather some perspective.
The discussion about corporate profit growth having nowhere to go but down is spot on - 17 quarters of double-digit profit growth combined with an increased number of share buybacks and m&a activity (read: little investment in future profit-generating, productive resources) doesn't paint a bright picture for earnings growth down the road.
Profits (wages) as a share of GDP are abnormally high (low), meaning that companies can easliy absorb increases in costs (energy) without putting a lot of pressure on the overall price level. This is one reason why it feels like the inflation readings should be higher than they are, but it simply hasn't materialized to this point. As the situation unwinds, however, the opposite will not be true - if wages begin to increase their share of GDP at the expense of profits, earnings will begin to disappoint and prices will certainly rise - a double-whammy when combined with a flailing housing market.
The level of earnings/profit growth is a direct result of companies keeping a larger percentage of their profits as opposed to re-investing them - if you decide not to buy a car you'll instantly be $50,000 richer but you'll be poorer in the long-run when you lose your job for not showing up. This is the kind of mentality that the oil industry has been criticized so heavily for (they're robbing us blind and not building new refineries!), but it seems like we're giving many other companies posting monster earnings growth quarter after quarter a free-pass despite their increasing similarity to oil companies' modus operandi.
In the end I think we'll remember that productive resources and innovation drive growth (which requires spending and lower near-term profits) - not simply re-distributing money so that more of it passes through everyone's hands.
Wednesday, September 13, 2006
Volatility Anyone?
Volatility in the Nasdaq has taken sharp turn upwards even by historically volatile Nasdaq standards. The chart below shows the volatility indices for Nasdaq in blue and the S&P in red - the Nasdaq is around 75% of its peak during the May/June selloff, while the S&P is nowhere near its June peak:
To add some perspective about how volatile the Nasdaq is now, the relative volatility of the Nasdaq versus the S&P is now at a 2-year high:
What this means for the levels of the S&P/Nasdaq isn't clear, but there appears only one way to go for the future of the volatility spread. It would be interesting to look at periods where the volatility spread is relatively high or low and how the respective markets performed.
Tuesday, September 12, 2006
Groundhog Rally
Another run-of-the-mill rally off the back of falling oil prices, by now a very familiar sight. While not unexpected (see yesterday's post, previous posts on this site re:oil prices), I still have some issues with how many times the market has rallied this year in response to oil price slides of varying degrees. The run-up in oil prices the past few years has not hampered the growth in corporate profits, and there have been as many explanations for this as there have been oil-based rallies - the US economy operates using far less oil per unit of output than 10 years ago, we live in a service-based economy and oil price spikes are a concern for developing countries that are newly industrialized...you get the picture.
So when oil futures drop off (in a predictable manner), shouldn't the reverse be true? Why should we anticipate that a slide in the price of oil would stimulate/stabilize profit growth? Especially in the immediate future - if the effects of oil price increases operate on a lag, shouldn't the same lag delay any expected benefits from falling oil prices?
The only immediate impact of oil's price is reduced gas prices at the pump, which I don't feel will have the consumption-inducing effect the market is hoping for. I felt that $60 oil would push the market to test its highs, and at $64 and the DJ at 11500 I feel even more confident that will be the case if oil gets that low, and I just don't think it is a rally that has staying power.
In more general news, this morning's WSJ notes that global fund managers' outlook for corporate profits has fallen to lows not seen since 2001. That doesn't mean they are bearish, however, as the same segment also notes increased optimism regarding the global equity outlook. So...defensive sectors are leading the way, but triple-digit rallies come on the back of oil price news. This market is semi-schizophrenic and the tension has investors looking for love in all the wrong places.
Monday, September 11, 2006
O-I-L spells relief
The drop off in oil prices over the last few months has investors excited as the price of crude pushes 6-month lows. As I've commented in this blog before on the upcoming price decline (here and here) to be expected, this development should not surprise investors nor should it surprise anyone, really. The cyclical behavior of oil is certainly not new, and the price still hasn't fallen as far as it could based on the last two fall/winter slumps in price.
In other speculative news gold has taken an absolute beating today relative to oil. The correlation between oil and gold is well established, but it seemed as if gold had found its own support levels and wouldn't be as severely impacted by the recent drop in oil prices. I really didn't anticipate the drop in oil prices having this drastic of an effect on gold. Here is the chart over the past week, today really stands out:
Wednesday, August 30, 2006
Mid-week Update
The market is higher than anticipated in last fridays post, largely due to reaction to the GDP number. GDP was revised upward primarily due to rising inventories, which will (as the thinking goes) reduce price pressures and signal the end to the rate cycle for good. I still haven't seen inflation data that convinces me there aren't any more rate increases coming - a slowing economy typically relieves pricing pressures, but the pressure built up in this market has been delayed for so long that I'm not sure a slowing economy will be enough to assuage inflation fears fast enough for the markets expectation. Think about the effect slow growth has on inflation like the lagged effect of monetary policy -it will not be overnight and it could be some time for price pressures to come down. Also, debate on whether or not energy prices can be ingored with respect to Fed policy has died down considerably and I think that there is some risk to not looking at potential effects of a consolidated build-up in energy prices like we have seen over the past few years. I don't know how many times the market is going to rally on the same news (the end of the rate cycle) only to run up against the same fears. I guess at least one more time.
NYSE/Euronext update
From my original post on aug 18th re: the proposed details of the merger, NYSE stock is down 1.6% to 59.05 (from 60.00), while euronext is up a nice 5.1% to 69.80 euros (from 66.40 euros).
Friday, August 25, 2006
The week ahead - Monday, August 28
The market is still debating whether or not a slowing economy is a good thing for stocks. It appears that the sentiment for the time being is still in favor of a slowing economy (end of rate cycle) versus signs of growth (inflation). As soon as rate/inflation uncertainty is resolved then the market will digest what that means for stocks. Whether or not that is the best philosophy for the long-term is debatable, but at least for now that is how the market is reacting, and until proven otherwise we can assume it will continue.
That being said, the data lineup for next week includes the Fed meeting minutes and 2 qtr GDP during the first half of the week. The minutes really don't have any room to surprise on the upside as the no-more-rate-increase rally went off 2 weeks ago, and I anticipate a somewhat muted to negative response to the minutes. Same story for GDP, I don't see any plausible scenario for the market cheering the GDP number regardless of where it falls. Thursday has factory orders, personal income, & jobless claims - some back-and-forth potential, but nothing earth shattering. Perhaps the bulls will try to regain some lost ground on the back of the no news. On the plate for Friday: manufacturing and two housing-related numbers - construction spending and pending home sales. On the back of further housing sector weakness I think we could see an attempted rally Friday, but I don't see it pushing the dow back into positive territory for the week.
Of course oil prices remain ever-important, and have the potential to turn next week into a big red week, or some relief could push up a week of modest gains. We'll see, but I think negative sentiment continues to permeate the market and I don't see much rally-sparking potential.
Wednesday, August 23, 2006
Housing Headwinds
TickerSense had a group performance matrix today showing relative sector performance over the past 20 days, and two sectors really caught my attention - housing and energy equipment & services. Both are buried in the middle, and by just looking at the average you would think they are fairly stable. However both of these sectors have had an unusually large number of days where they were either best or worst performing sector. The volatility in energy equipment is understandable as energy prices are far more volatile than mortgage rates.
So what's the deal with homebuilder stocks? They had 3 days with the best performance and 3 with the worst. Not really sure quite what to make of investors who propelled housing stocks to the top for those three days...I thought it was a relatively straightforward story - interest rates are high and driving up mortgages, prices are bloated, inventories are building up, homebuilder sentiment is near record lows...the list goes on. With homebuilder sentiment and overall prospects for growth what they are I think homebuilders have far more downside exposure at this point, but it appears as if the market is having a difficult time forming a consensus regarding homebuilder stocks. It will be interesting to see if they post fewer days in the green as we get even more info about the housing cooldown.
Tuesday, August 22, 2006
Return to Risky Assets?
here's a 3 month chart comparing the MSCI EAFE, Mexican IPC, and S&P 500. It really depends on what you're looking for and the time period you're looking at as to what conclusions you can draw from this comparison. That being said this chart is a little surprising to me, although maybe it shouldn't be. Doesn't look to be much upside left in emerging markets unless the US experiences a sustained, committed rally (not likely) - world markets are falling more with bad US news and rising comparatively less with the good. Another reason to be skeptical of last week's rally.
Monday, August 21, 2006
Oil Price Debate - part II
How will oil prices affect the market for the remainder of the year? Seeing as the market is poised to rally at the drop of a hat in response to any good news (as evidenced by last week), the cyclical decline in oil prices towards year's end could spark a disproportionately large rally (a somewhat hollow one as well). If oil surprises on the downside I don't see how the market could contain itself given the tension and nervousness present these days, and you would have to believe markets would test their 2006 highs if such a scenario were to take place. I believe we can expect oil to dip in the neighborhood of $65, with a downside surprise occurring at around $60. So if oil gets to around $60 this winter - look out below. Heck, given the current market sentiment $65 a barrel oil could light a fire under the markets.
Oil Price Debate
Recent talk of drastic oil price drops given recent price declines seem to me to be overly optimistic. These scenarios rely too heavily on a number of assumptions that are unlikely to occur, and the likelihood that all will occur together is even slighter still. Here is a chart for the past 2 years of oil prices:
Other than this past February/March, the only time the price dipped below the 240 day MA has been the past two Decembers. The rallies off these December lows were 116% and 89% of the previous Sept/Oct highs. Given these rallies, institutional investors would be more likely to play the historical tendencies than bet against them - buying into the new year and preventing the December slump from escalating.
The past 3 selling periods have topped off at 76% of the previous rally (the current downtrend is at 43%) meaning that even a large selloff wouldn't be likely to breach $65. The 240 day MA and the 76% guideline both point towards a target of $65 for the upcoming 4th quarter slump in oil prices. And that assumes there will not be another rally in prices for the rest of the year.
It does seem like we are moving towards a market where bad news will be net positive once the situation is resolved (upticks getting smaller while relief selloffs getting larger as optimism grows), although I do not see that resulting in any major movements downward over the longer term. China's oil imports are rising at 8% year-over-year with no signs of easing - I don't see how positive news regarding US stockpiles can overcome that 8%.
Friday, August 18, 2006
Yuan Control
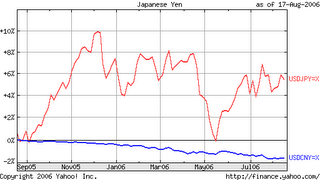
We're all familiar with the lip service given to an increasing Yuan by the Chinese government, but are they finally getting serious? The Chinese government has announced another rate increase on top of their recent efforts to tighten lending restrictions. The end(?) of the US rate hike cycle along with increasing Chinese rates should help boost the Yuan - key word being should. To illustrate how adept China remains at controlling the exchange rate, here is their track record compared to the USD/Yen exchange rate over the past year:
Not going anywhere other than 1.8% a year.
I think we can also deduce the "basket" of currencies China is using to measure the Yuan against by this chart - the US Dollar and a basket of currencies that are pegged to the dollar.
Not going anywhere other than 1.8% a year.
I think we can also deduce the "basket" of currencies China is using to measure the Yuan against by this chart - the US Dollar and a basket of currencies that are pegged to the dollar.
Thursday, August 17, 2006
NYSE/Euronext Merger
Given that the terms have been disclosed for the NYSE/Euronext merger and it includes a cash payout along with share conversion for Euronext shareholders, it will be interesting to see what happens to the prices of those stocks. When you consider that the cash payment is in euros along with the fact that Euronext is traded on three exchanges (I'm only using the Paris price from the euronext site) you get enough variables to create any number of potential plays on this merger.
From the NYSE/Euronext merger details from the June 1 announcement (from the NYSE website):
Using yesterday's share prices ($60.00 for NYX, Eur 66.40 for NXT.PA) at yesterday's exchange rate (1.284 Eur/$), you get a $US 85.26 share price for Euronext stock which has a current value of $86.17 (0.98 NYSE shares x $60.00/share + Eur 21.32 x 1.284 Eur/$) - a nice and tidy $0.91 profit per share. That of course assumes that the $60/share market price is the accurate valuation for the new NYSE Euronext stock. If all euronext stock were converted at 0.98 to 1 and NYSE stock 1 to1, there would be a total of 264.52 million shares of the new NYSE Euronext stock. At $60 per share, thats a market cap of $15.87 billion compared to the NYSE estimate of $20 billion. Obviously they benefit from overestimating the valuation, but 4+ billion seems like a rather large discrepancy.
Consider another alternative - the current valuation of each company added together equals the total valuation for the new NYSE Euronext. Under this assumption, total market cap would be $18.8 billion, with a share price of $71.09. If the share price of the NYSE Euronext reaches that level, the current value of holding 1 share of Euronext stock rises to $98.46, a $13.20 per share profit over the current purchase price of $85.26...
It all comes down to where you feel the new NYSE Euronext stock price will fall, and I don't see how it can be any lower than $60/share regardless of what the NYSE price does in the near future. The movement in the NYSE seems to be consolidating around the $60 a share price, and the ratio of NYSE stock price to performance of the underlying stocks (represented by NYC price) is 0.78, with the Nasdaq having a share price to underlying stock value (measured by QQQQ price) of 0.76. You also get to play the dollar's decline by being in Euronext (the cash is in euros).
Throw a third party into the mix and you get even more options. Here is the ratio of the Nasdaq share price to NYSE share price - it has just bumped above the 90-day MA and the Nasdaq looks like it is poised to continue this uptrend versus the NYSE...Nasdaq has kind of sat back watching the NYSE-Euronext tie up and you know they will make a move at some point for the LSE, and I think they will ultimately be successful.
Sorry for all the numbers in today's post, but I thought it essential to taking a look at potential plays in this situation. The exchanges are extremely difficult to value to begin with, so you get a lot of valuations that really haven't been around long enough to have a track record. Who really knows what they're worth? There are so many potential ways to go about it, and you would think at some level the success of the exchanges depends upon the success of their member stocks. The sector has a wild west feel to it right now, and it just feels like the next few years will have been the time to have done the analysis and made the more profitable plays on exchange stocks. There are less and less of them, and they will only become more stable as valuation methodologies mature and the m&a activity in this sector eventually slows.
From the NYSE/Euronext merger details from the June 1 announcement (from the NYSE website):
NYSE shareholders get 1 share of the NYSE Euronext stock per NYSE share.
Euronext shareholders get 0.98 shares of NYSE Euronext stock plus a cash payment of 21.32 euros per Euronext share.
Using yesterday's share prices ($60.00 for NYX, Eur 66.40 for NXT.PA) at yesterday's exchange rate (1.284 Eur/$), you get a $US 85.26 share price for Euronext stock which has a current value of $86.17 (0.98 NYSE shares x $60.00/share + Eur 21.32 x 1.284 Eur/$) - a nice and tidy $0.91 profit per share. That of course assumes that the $60/share market price is the accurate valuation for the new NYSE Euronext stock. If all euronext stock were converted at 0.98 to 1 and NYSE stock 1 to1, there would be a total of 264.52 million shares of the new NYSE Euronext stock. At $60 per share, thats a market cap of $15.87 billion compared to the NYSE estimate of $20 billion. Obviously they benefit from overestimating the valuation, but 4+ billion seems like a rather large discrepancy.
Consider another alternative - the current valuation of each company added together equals the total valuation for the new NYSE Euronext. Under this assumption, total market cap would be $18.8 billion, with a share price of $71.09. If the share price of the NYSE Euronext reaches that level, the current value of holding 1 share of Euronext stock rises to $98.46, a $13.20 per share profit over the current purchase price of $85.26...
It all comes down to where you feel the new NYSE Euronext stock price will fall, and I don't see how it can be any lower than $60/share regardless of what the NYSE price does in the near future. The movement in the NYSE seems to be consolidating around the $60 a share price, and the ratio of NYSE stock price to performance of the underlying stocks (represented by NYC price) is 0.78, with the Nasdaq having a share price to underlying stock value (measured by QQQQ price) of 0.76. You also get to play the dollar's decline by being in Euronext (the cash is in euros).
Throw a third party into the mix and you get even more options. Here is the ratio of the Nasdaq share price to NYSE share price - it has just bumped above the 90-day MA and the Nasdaq looks like it is poised to continue this uptrend versus the NYSE...Nasdaq has kind of sat back watching the NYSE-Euronext tie up and you know they will make a move at some point for the LSE, and I think they will ultimately be successful.
Sorry for all the numbers in today's post, but I thought it essential to taking a look at potential plays in this situation. The exchanges are extremely difficult to value to begin with, so you get a lot of valuations that really haven't been around long enough to have a track record. Who really knows what they're worth? There are so many potential ways to go about it, and you would think at some level the success of the exchanges depends upon the success of their member stocks. The sector has a wild west feel to it right now, and it just feels like the next few years will have been the time to have done the analysis and made the more profitable plays on exchange stocks. There are less and less of them, and they will only become more stable as valuation methodologies mature and the m&a activity in this sector eventually slows.
Wednesday, August 16, 2006
Rally Monkey vs. Kool-Aid Man
Is it time to celebrate? Has the rally monkey been sighted and we're prepared for even more upside - or was it the kool-aid man attempting to add loads of artificial flavoring only to leave us empty?
Today's rally still has me feeling a bit uneasy about the prospects over the next few months, feels like a little too much excitement over a little too little news. It has been noted that PPI and CPI same-month correlation is extremely poor - Tom Graff posted a nice chart yesterday on his Accrued Interest blog illustrating this point and how volatile PPI readings are. As for today's CPI number the WSJ had an interesting article a couple days back about the imprecision inherent in the BLS data as a result of rounding to a tenth of a percent. This means that instead of dropping a full 0.1% from 0.3% to 0.2%, the more likely scenario is something along the lines of 0.254% falling to 0.243%. Not much to write home about.
Bonds and stocks have been humming along the last 2 days, and I don't see how they can both be right (can you guess who I side with?) - both markets are now rallying based on the same news and you suspect someone is going to get burned. No further rate hikes is truly great news for the bond bulls, not so much for stock bulls. This has everything to do with WHY there won't be any further hikes as opposed to the fact that there just won't be any. The last time the market cheered this much for a slowing economy and rapidly cooling housing sector was...it doesn't really matter. They're cheering now, and that's the point. Throw in the possibility - as unlikely as it may be - for another rate hike prior to the end of the year and the outlook for stocks is even worse. Personally I'd rather be prepared to weather the worst and try to avoid the ever-tempting kool-aid at this point.
Tuesday, August 15, 2006
World Cup Hangover - Part II
I commented yesterday about the post-world cup slump in German stocks, and wanted to go back to other world cups to find out if there was any precedent for such a slump among host nations, and if so, the duration of those slumps. I also wanted to look at the years leading up to the world cup to see if there is evidence of a pre-cup rally as the economy gears up to host. Can we expect a rally in German stocks, and beyond that, is it time to jump into South Africa well ahead of the game to secure some longer-term gains?
I looked at the past 4 world cups (5 nations - Korean and Japanese markets were both included as they were both host nations in 2002) at the market performance of the host country starting with the August after the prior world cup, or roughly 4 years prior to their host cup. This is about the timing they announce the site for the next cup, or at least when people focus on the next nation to host (South Africa already has their world cup website up). Here is the chart:
To say that there are other factors that affected these markets during this time is a gross understatement, but given that these charts cover a span of 16 unique years (1990-2006) and each series is separated by four years (save the Nikkei and Kospi which run concurrently), any clear trends discernable from the data would suggest evidence of a world-cup related effect.
From the apparent chaos some trends emerge - the markets begin to move together in the year prior to the world cup, and continue to do so to an even greater degree after the cup, suggesting there are some world cup related effects on host-country markets. The first three sections (representing 4 years prior through 2 years prior to hosting) aren't very noteworthy and they are left out of the subsequent discussion. No trends, none expected. Too far away from investors minds at that point.
The first year of interest is the year leading up to the hosting of the cup. During this year ( like the three preceding years) 3 markets rose and 2 fell. There are a couple reasons why this year is more interesting than the 3 previous: it is the only year out of all 6 that the Kospi and Nikkei moved in opposite directions, and the only period where the S&P and Nikkei were the only markets to decline. You could make a good case here that the US and Japan would not be significantly affected by hosting the world cup (size of economy, interest in soccer, linkages between US and Japanese economy) and that Germany, France, and South Korea would be a more representative set of countries poised for a world-cup induced rally. All three of these markets rose during the year leading up to the cup. Even more interesting are the post-cup trends. Below is a chart showing the growth from the point the world cup ends:
There is a clear short-term hangover effect in play here following the end of the world cup (except in the S&P, which treaded water through December). When you compare this with yesterday's chart of the DAX, the German hangover to this point appears to be a microcosm of the somewhat longer (2-4 month) hangover experienced by other host nations in the past. Regardless of the extent of the decline, all the host nations I looked at experienced a market bottom within a year of the end of the world cup (even the S&P) followed by a year-long rally. Check out the one-year returns beginning in March following the world cup - an average of 38.5% return for the four markets shown, 42.9% average if you exclude the US. While the specific timing of post-world cup rallies may differ, it seems clear that hosting a world cup is a bullish signal after the market reconciles lofty pre-world cup expectations with post-world cup buyers remorse.
Monday, August 14, 2006
World Cup Hangover?
After all the hype prior to the start of the World Cup about the boost the event would provide for the German economy, how have German stocks performed thus far? The chart below shows how the DAX has performed to date since the final match day:
It appears that short term sentiment was sharply negative immediately following the world cup, with a subsequent rally bringing the index back towards positive territory - only to see the index hover between 0% and -2% growth for the last couple weeks.
How can this be explained given that so much money was pumped in to the German economy in the form of capital spending (huge construction contracts to retrofit/build stadiums) and tourism dollars? What does the market know that the politicians did not?
Like any business venture, the world cup is all about managing expectations. When viewed for what it really is - a month long marketing campaign - the WC is subject to the same pitfalls that any business is, and seems especially prone to overspending while riding the massive wave of social excitement that comes along with it. Imagine the problem created by a retailer who overspends on inventory in hopes of future sales. Then picture every retailer within 30 minutes of any train station in the country doing the same and you get the picture. The WC would have to generate massive amounts of profits almost overnight to be viewed as a success and cheered by the market. Such expectations are almost impossible to live up to, and when expectations exceed results you get the graph depicted above.
A great illustration of this type of over-billing an event is the bicentennial celebration of Lewis & Clark's journeys. You might argue that you can't compare something that happened so long ago with such a recent event as the world cup, but this "celebration" was held this year, and yes, was an absolute flop. The Wall Street Journal ran an article about it on July 19:
I'm not suggesting you can draw any valid comparisons between that event and something as huge as the world cup (an event that infatuates people to the degree that cease-fires are instituted just to tune in), but you get the idea.
This is not to say I would base any conclusions about the economic benefits of the WC based solely on the graph shown above, but I do think it contains some worhtwhile lessons. Another critical part of the picture would be to examine how the market performed during the build-up to the WC. If further examination revealed a pre-WC rally, then the post-WC hangover should not be surprising. That is another topic entirely, and I will have more on the timing and longer-term market effects of the WC tomorrow...
It appears that short term sentiment was sharply negative immediately following the world cup, with a subsequent rally bringing the index back towards positive territory - only to see the index hover between 0% and -2% growth for the last couple weeks.
How can this be explained given that so much money was pumped in to the German economy in the form of capital spending (huge construction contracts to retrofit/build stadiums) and tourism dollars? What does the market know that the politicians did not?
Like any business venture, the world cup is all about managing expectations. When viewed for what it really is - a month long marketing campaign - the WC is subject to the same pitfalls that any business is, and seems especially prone to overspending while riding the massive wave of social excitement that comes along with it. Imagine the problem created by a retailer who overspends on inventory in hopes of future sales. Then picture every retailer within 30 minutes of any train station in the country doing the same and you get the picture. The WC would have to generate massive amounts of profits almost overnight to be viewed as a success and cheered by the market. Such expectations are almost impossible to live up to, and when expectations exceed results you get the graph depicted above.
A great illustration of this type of over-billing an event is the bicentennial celebration of Lewis & Clark's journeys. You might argue that you can't compare something that happened so long ago with such a recent event as the world cup, but this "celebration" was held this year, and yes, was an absolute flop. The Wall Street Journal ran an article about it on July 19:
Paging Sacagawea: Lewis and Clark have lost their way again.
When President Bush issued a proclamation in 2002 creating a Lewis and Clark Bicentennial celebration, tourism officials from Virginia to Oregon pounced on it as a potential blockbuster. But as the three-year celebration enters its homestretch, participating communities are still waiting for the Lewis and Clark gravy train to leave the station.
"It's the great Lewis and Clark letdown," says Dave Hunt, a wholesaler of bicentennial knickknacks, including commemorative spoons and refrigerator magnets, in Lewiston, Idaho.
And Great Falls, Mont., learned the hard way how many people were interested in its claim to Lewis and Clark fame. So few people turned out last summer to commemorate the pair's portage around the falls of the Missouri River that the city ended up $535,000 in debt. Ticket sales failed to cover the $1.6 million cost of staging events including river tours and a powwow. Says organizer George Horse Capture: "People acted like they would rather stay home and mow the lawn."
I'm not suggesting you can draw any valid comparisons between that event and something as huge as the world cup (an event that infatuates people to the degree that cease-fires are instituted just to tune in), but you get the idea.
This is not to say I would base any conclusions about the economic benefits of the WC based solely on the graph shown above, but I do think it contains some worhtwhile lessons. Another critical part of the picture would be to examine how the market performed during the build-up to the WC. If further examination revealed a pre-WC rally, then the post-WC hangover should not be surprising. That is another topic entirely, and I will have more on the timing and longer-term market effects of the WC tomorrow...
Wednesday, August 09, 2006
Markets give all clear nod to international stocks
International markets appear to have cheered the pause in the fed tightening campaign, as they have resumed their climb prior to the May selloff. MSCI EAFE is up just over 10% on the year while the S&P is barely above where it began the year (up 0.2%). The increasing US-World spread seems to correspond with the increase in implied odds of a Fed pause. Didn't have the time to put that graph together, but it would be interesting to look at. Here is the last 6 months of EAFE performance vs. the S&P:
I commented yesterday how US markets seemed to be overly optimistic regarding the end of the tightening cycle (not reflecting enough the culprit for the pause, namely slow growth), and that bug seems to have bitten international markets of late. Ticker sense had an updated version of their global ETF overbought/oversold indicator, and it is interesting to note that two of the countries that register as "overbought" and have shown some of the largest pickup since the Fed announcement are our neighbors - Mexico and Canada. US markets have had muted response to the Fed pause, and I can't help but wonder if jumping into Canadian and Mexican markets isn't just a bit premature with dim US growth prospects. The full effects of the most recent increase to 5.25% have yet to be felt, and the coming slowdown in the US is certain to impact both of those countries greatly. It will be interesting to see if Mexico and Canada continue to run with the international crowd or if they come back down to earth with the US.
Tuesday, August 08, 2006
Surveying the Fed Landscape
I think I'm required by law to comment on the Fed leaving rates steady earlier today, so here goes. No surprise to the market, although now it would come as a major jolt if they were to raise again at the next meeting, which - given the recent inflation data - is not out of the question. I find it interesting that the market lost ground today, especially given the way investors cheered previously at every turn when it looked as if the rate cycle was over. Finally they got the picture: rates were let stand today due to slow growth, and the prospect of even slower growth down the road. When the fed has enough confidence that the economy will slow to the point of restraining inflationary pressures, that is NOT a positive sign for growth in the near future. The market has recovered from their temporary memory loss in time to figure this one out. Cheers.
In other news, the Indianapolis Colts are the favorite to win the 2007 super bowl at 11/2 according to vegas.com. Really? New England owns them in the playoffs, they lose a superstar running back in Edgerrin James, and they're now the favorite? I wouldn't even pick them to succeed the Bills as the best team to choke every time it matters. At least Buffalo was getting to Super bowls consistently. I'll take the field. In the NFC, the Bears and Seahawks are both 11/1 - I have little doubt the Bears won't get there, but hopefully their fans believe otherwise. The Seahawks would be an attractive pick if they don't get any love and their odds drop a bit.
Monday, August 07, 2006
Fund Mangers to Public: We don't want your money
BBC News photo
An interesting story today from the WSJ ("Investors Go on a Learning Curve") highlights efforts by traditionally "hot" fund companies to encourage discretion and discourage performance chasing by investors. While that is being hailed as a good development, and it may well turn out to be, consider this quote from the VP of retail marketing at Janus:
"There's nothing worse than investors getting a fund that's way too hot...and have them be unhappy after three months...Chasing performance isn't good for anyone -- not for the fund companies, not for investors, and it's not good for the funds."There are many ways to interpret this statement, none of which are positive (nothing against Janus in particular, the statement just happened to come from their VP). Are we to believe then that the investor chasing the latest trends, making trade after trade and racking up trading fees along the way is bad for business? Is this finally an admission that as funds become bloated they grow so large as to be unwieldly, meaning that they will accept less money per fund in the future?
The predictable response here is that over the long run the trader that gets burned by chasing performance is bad for business, but that to me is more indicative of a problem with fund design and less an indictment of investor behavior.
The decision to do away with an established business strategy in favor of adopting someone else's is questionable at best. Announcing that the goal is to no longer chase returns while modeling new funds after those that have coincidentally outperformed of late is not only somewhat contradictory, it also sends the wrong message to investors, especially those whose business you are looking for. Does the market really need more funds that mimic the returns of other funds? Should new products really be geared towards chasing returns of more "stable" areas of the market, and dilute those returns even further?
The whole statement reeks of confusion, and is another reason to be skeptical of marketing statements regarding any type of investment. Period.
The message is clear: Buy a share of a fund that is designed to underperform and sit on it in perpetuity.
Sunday, August 06, 2006
Sunday Afternoon
Watching the best of the 90s marathon today -things definitely worth re-hashing: The Dream Team absolutely annihilating the "competition". Don't think we'll ever see anything like it - Michael, Magic, Bird, Barkley...the list goes on and on. That 92 olympics was probably the single greatest international competition ever as far as entertainment value. Maybe combine a few world cups to earn a respectable second behind the DT.
Seems like the 10-year is overbought - the fact that the fed is likely to pause in August seems to have made people forget that they do have meetings scheduled beyond August, and at this point I wouldn't bet against another increase before we get a drop.
Saturday, August 05, 2006
Inaugural Address
This blog will cover any interesting topics or observations related to economics (from the perspective of a grad student), strategy and statistics related to financial engineering (gambling) in its many forms - the stock market, poker, etc...and anything not mentioned above that may be worth discussing.
Feel free to comment on anything you read here.
Subscribe to:
Posts (Atom)
NYSE/Euronext Merger
Enter the current share prices for NYSE and Euronext, as well as the USD/Euro Exchange rate and hit "calc" to view relevant data. Deal was announced 6/1/2006.